Quick Start Guide to OpenSearch Log Ingestion
Last week, Daniel Weinshenker wrote an interesting article Observability 101: Start with Logs, which covered log-based alerting with OpenSearch.
Daniel has graciously reached out to collaborate with him to cover this topic from another lens. In this post, I focus on a different aspect: getting your app’s logs into OpenSearch in the first place, using a containerized setup you can run locally.
The goal of this article is to help you quickly set up an app that has its logs ingested into OpenSearch.
Why This Matters
Before you can alert on logs, you need them flowing somewhere searchable. If you have ever docker logs-ed your way through an incident (scrolling, grepping, losing context etc) you already know the pain this solves.
This guide wires up a complete local pipeline:
Node.js App (stdout)
      ↓
  Fluent Bit        ← collects & parses
      ↓
  OpenSearch        ← indexes & stores
      ↓
  Dashboards        ← query & visualize
By the end you will have a working environment where every log line your app writes is immediately searchable in a UI, filterable by level, service, or any structured field.
Prerequisites
- Docker and Docker Compose installed
- At least 4 GB of available RAM (OpenSearch is memory-hungry)
- The following ports free:
3000,5601,9200,24224
Clone this Github project directory that has this structure:
.
├── docker-compose.yml
├── app/
│   ├── index.js
│   └── package.json
└── fluent-bit/
    ├── fluent-bit.conf
    └── parsers.conf
I will go through all the important components to help explain how logs are ingested into OpenSearch.
The Architecture
There are four moving parts. Understanding what each one does will save you a lot of debugging time.
The Node.js app writes structured JSON logs to stdout. This is intentional. In Docker, stdout is the canonical log stream. Nothing is written to a file.
Fluent Bit acts as the log collector. The app container is configured with the fluentd Docker logging driver, which forwards all stdout output to Fluent Bit over TCP on port 24224. Fluent Bit then parses the JSON, enriches it and forwards it to OpenSearch.
You might wonder why Fluent Bit is needed at all. Couldn’t the app just write directly to OpenSearch? It could, but that would tightly couple your application to your observability infrastructure. If OpenSearch is down, slow or being migrated, your app would be directly affected. Fluent Bit acts as a buffer and intermediary. It absorbs logs from your app at whatever rate they are produced, handles retries if OpenSearch is temporarily unavailable and lets you change your backend (say, swapping OpenSearch for another store) without touching a line of application code. It also takes on the parsing and enrichment work that your app otherwise should not care about.
OpenSearch receives those parsed log events and indexes them into daily indices named app-logs-YYYY.MM.DD. It exposes a REST API on port 9200.
OpenSearch Dashboards provides the web UI at port 5601. It reads directly from OpenSearch. No data gets stored in OpenSearch Dashboards. It is purely a query and visualization layer.
Step 1: The Node.js App
Your app should emit structured JSON logs to stdout. Here is a minimal example using a simple logger:
// Simple Express app that generates various log types
const express = require('express');
const app = express();
const port = 3000;

// Middleware to log all requests
app.use((req, res, next) => {
  console.log(JSON.stringify({
    timestamp: new Date().toISOString(),
    level: 'info',
    method: req.method,
    path: req.path,
    ip: req.ip,
    userAgent: req.get('user-agent')
  }));
  next();
});

app.get('/', (req, res) => {
  res.json({ message: 'Hello World!' });
});

app.get('/error', (req, res) => {
  console.error(JSON.stringify({
    timestamp: new Date().toISOString(),
    level: 'error',
    message: 'This is a simulated error',
    errorCode: 'ERR_SIMULATED'
  }));
  res.status(500).json({ error: 'Simulated error' });
});

app.get('/warn', (req, res) => {
  console.warn(JSON.stringify({
    timestamp: new Date().toISOString(),
    level: 'warn',
    message: 'This is a warning message',
    context: 'performance degradation detected'
  }));
  res.json({ warning: 'Check logs' });
});

// Generate periodic logs
setInterval(() => {
  const logTypes = ['info', 'debug', 'warn'];
  const randomType = logTypes[Math.floor(Math.random() * logTypes.length)];

  console.log(JSON.stringify({
    timestamp: new Date().toISOString(),
    level: randomType,
    message: `Periodic log message - ${randomType}`,
    metric: Math.random() * 100,
    service: 'example-app'
  }));
}, 5000);

app.listen(port, () => {
  console.log(JSON.stringify({
    timestamp: new Date().toISOString(),
    level: 'info',
    message: `Example app listening on port ${port}`,
    service: 'example-app'
  }));
});
Note that every log is a JSON object with at minimum timestamp, level and message. This makes downstream filtering in OpenSearch trivial.
Step 2: Fluent Bit Configuration
Fluent Bit needs two config files - fluent-bit.conf and parsers.conf.
fluent-bit/fluent-bit.conf is the main pipeline config:
[SERVICE]
    Flush        5
    Daemon       Off
    Log_Level    info
    Parsers_File parsers.conf

[INPUT]
    Name              forward
    Listen            0.0.0.0
    Port              24224
    Buffer_Chunk_Size 1M
    Buffer_Max_Size   6M

[FILTER]
    Name   parser
    Match  app.logs
    Key_Name log
    Parser docker_json
    Reserve_Data On
    Preserve_Key On

# Push logs to OpenSearch
[OUTPUT]
    Name            es
    Match           *
    Host            opensearch
    Port            9200
    Index           app-logs
    Type            _doc
    Logstash_Format On
    Logstash_Prefix app-logs
    Retry_Limit     5
    Suppress_Type_Name On
fluent-bit/parsers.conf tells Fluent Bit how to decode incoming log lines:
[PARSER]
    Name        docker_json
    Format      json
    Time_Key    timestamp
    Time_Format %Y-%m-%dT%H:%M:%S.%L%z
    Time_Keep   On

[PARSER]
    Name        syslog
    Format      regex
    Regex       ^\<(?<pri>[0-9]+)\>(?<time>[^ ]* {1,2}[^ ]* [^ ]*) (?<host>[^ ]*) (?<ident>[a-zA-Z0-9_\/\.\-]*)(?:\[(?<pid>[0-9]+)\])?(?:[^\:]*\:)? *(?<message>.*)$
    Time_Key    time
    Time_Format %b %d %H:%M:%S

[PARSER]
    Name        json
    Format      json
    Time_Key    time
    Time_Format %d/%b/%Y:%H:%M:%S %z
A few things worth noting here. The [INPUT] uses the forward plugin (not tail) because logs arrive over TCP from Docker’s logging driver, not from a file. The [FILTER] parser extracts fields from the raw JSON string stored in the log key. After this step, level, message, service and any other fields you log become top-level, searchable fields in OpenSearch.
Step 3: Docker Compose
This is where the wiring happens:
version: '3.8'

services:
  # Example Application - Simple Node.js app that generates logs
  example-app:
    image: node:18-alpine
    container_name: example-app
    working_dir: /app
    volumes:
      - ./app:/app
    command: node index.js
    # Push logs to Fluentbit using the Fluentd driver
    logging:
      driver: "fluentd"
      options:
        fluentd-address: localhost:24224
        tag: app.logs
    depends_on:
      - fluent-bit
    ports:
      - "3000:3000"
    networks:
      - logging-network

  # Fluent Bit - Log collector and forwarder
  # Fluent Bit uses `fluent-bit.conf` to know where to send the logs to
  fluent-bit:
    image: fluent/fluent-bit:2.2
    container_name: fluent-bit
    volumes:
      - ./fluent-bit/fluent-bit.conf:/fluent-bit/etc/fluent-bit.conf
      - ./fluent-bit/parsers.conf:/fluent-bit/etc/parsers.conf
    ports:
      - "24224:24224"
      - "24224:24224/udp"
    depends_on:
      - opensearch
    networks:
      - logging-network

  # OpenSearch - Search and analytics engine
  opensearch:
    image: opensearchproject/opensearch:2.11.0
    container_name: opensearch
    environment:
      - discovery.type=single-node
      - bootstrap.memory_lock=true
      - "OPENSEARCH_JAVA_OPTS=-Xms512m -Xmx512m"
      - "DISABLE_INSTALL_DEMO_CONFIG=true"
      # Do not use this settings in production
      - "DISABLE_SECURITY_PLUGIN=true"
    ulimits:
      memlock:
        soft: -1
        hard: -1
      nofile:
        soft: 65536
        hard: 65536
    volumes:
      - opensearch-data:/usr/share/opensearch/data
    ports:
      - "9200:9200"
      - "9600:9600"
    networks:
      - logging-network

  # OpenSearch Dashboards - Visualization and exploration UI
  opensearch-dashboards:
    image: opensearchproject/opensearch-dashboards:2.11.0
    container_name: opensearch-dashboards
    environment:
      - 'OPENSEARCH_HOSTS=["http://opensearch:9200"]'
      - "DISABLE_SECURITY_DASHBOARDS_PLUGIN=true"
    ports:
      - "5601:5601"
    depends_on:
      - opensearch
    networks:
      - logging-network

networks:
  logging-network:
    driver: bridge

volumes:
  opensearch-data:
The most important part is the logging block on the example-app service. By setting driver: fluentd, Docker intercepts all stdout/stderr from that container and ships it to Fluent Bit at localhost:24224. The tag becomes the Fluent Bit routing key that you can use in Match rules.
Step 4: Start Everything
Running First Time
You need to install all the important NPM packages the first time you run it.
# Install app dependencies first
cd app && npm install && cd ..
Spinning Up Core Containers
# Start all services in detached mode
docker-compose up -d

# Optional: Watch Fluent Bit to confirm logs are being received and forwarded
docker-compose logs -f fluent-bit
Give OpenSearch about 30–60 seconds to initialize. You can check the health of OpenSearch by calling docker-compose logs -f opensearch.
One practical consideration regardless of cloud provider: make sure the Fluent Bit service is managed by systemd so it restarts automatically on crash or reboot (sudo systemctl enable fluent-bit). The main difference between EC2 and Droplets when it comes to networking is the firewall tool. EC2 uses Security Groups configured in the AWS console, while DigitalOcean uses Cloud Firewalls (also in their control panel) or the host-level ufw. Either way, you need to open port 9200 (HTTP) or 443 (TLS) between your VM and your OpenSearch endpoint. For log files that rotate via logrotate, Fluent Bit’s tail plugin handles this gracefully by tracking file inodes rather than names, so rotation does not cause missed log lines. You can check its health with:
curl http://localhost:9200/_cluster/health?prettyYou are looking for "status": "yellow" or "status": "green". Yellow is expected and fine for a single-node setup.
Step 5: Generate Some Logs
By default, the app also emits logs periodically. The app also exposes 2 endpoints you can hit to generate different log levels:
# ERROR log
curl http://localhost:3000/error

# WARN log
curl http://localhost:3000/warn
You can call the commands above to generate more logs of certain type if needed.
Step 6: Explore in OpenSearch Dashboards
Now that we have OpenSearch ecosystem set up, we can start using it.
One-time Setup
We will start by a one-time setup: creating index patterns. You can skip this if you have already created index pattern.
- Open
http://localhost:5601in your browser. You will see a welcome screen.
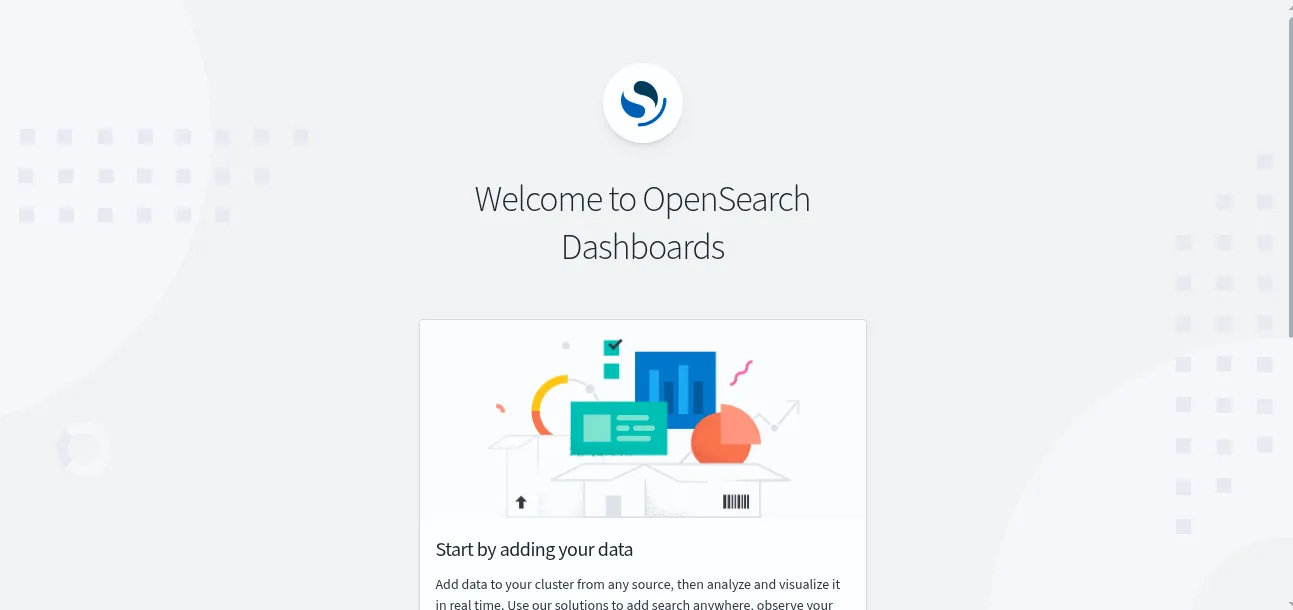
- Click “Add Data” just to get to the next screen. We don’t need to add data.
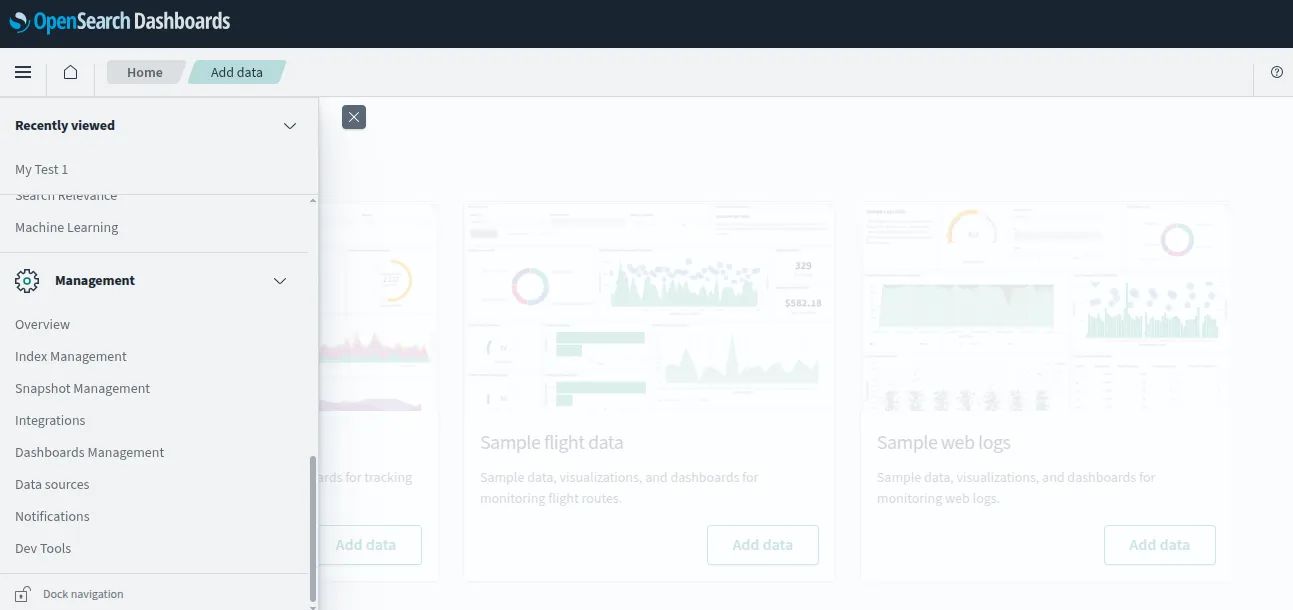
- Navigate to ☰ → Dashboard Management → Index Patterns.
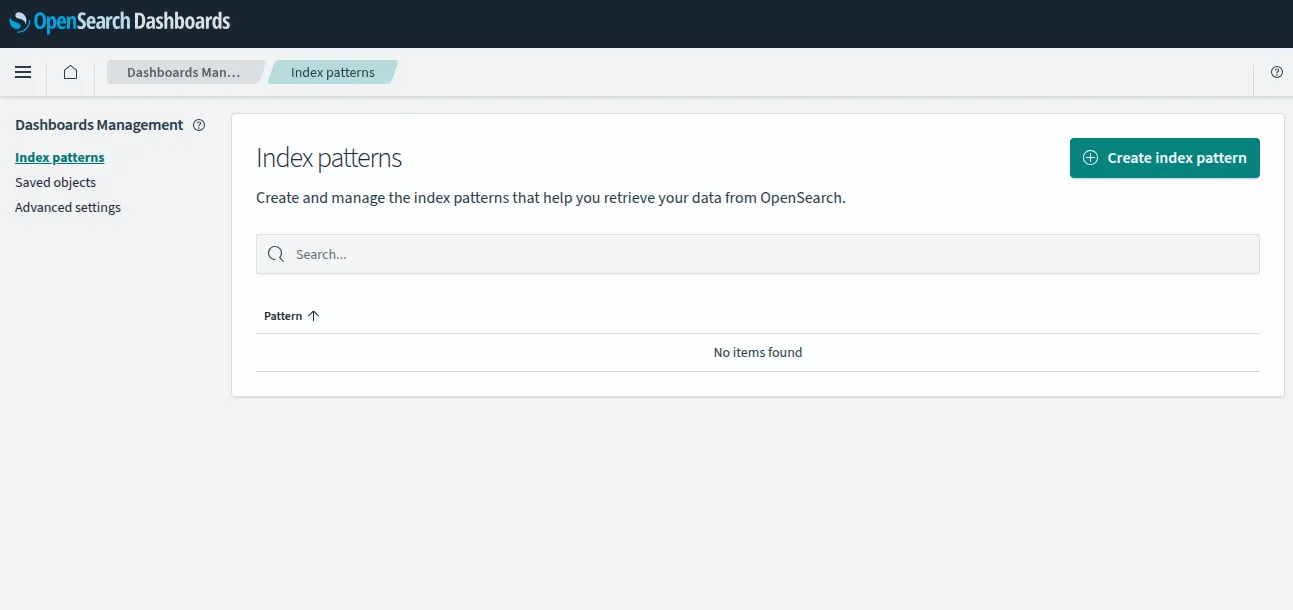
- Click Create index pattern, enter
app-logs-*and click Next step.
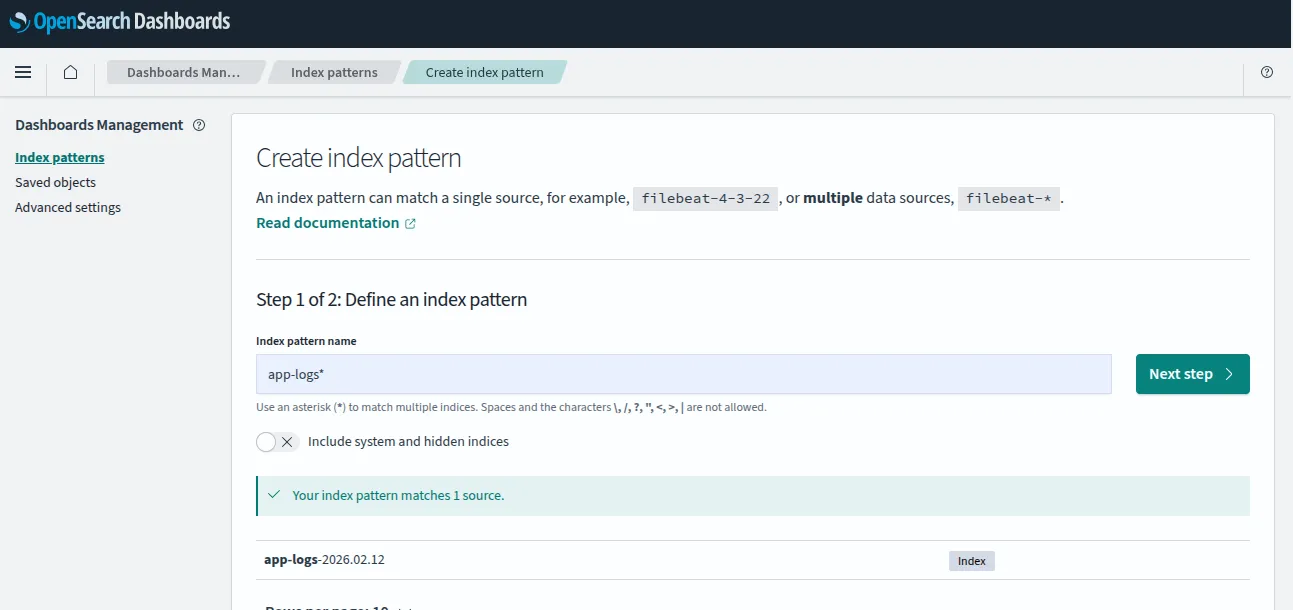
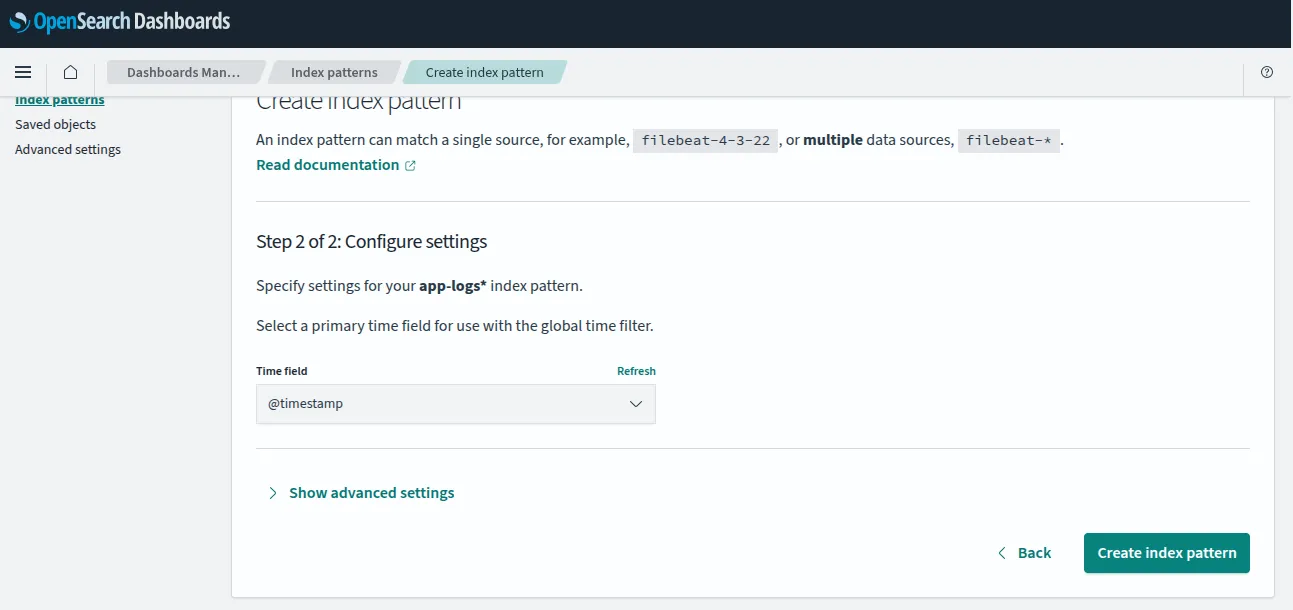
- Select
@timestampas the time field and click Create index pattern.
Please note index pattern is not creating an index in OpenSearch core app. This is for the dashboard app to know which log files to search for on the Dashboard app.
Using OpenSearch Dashboards
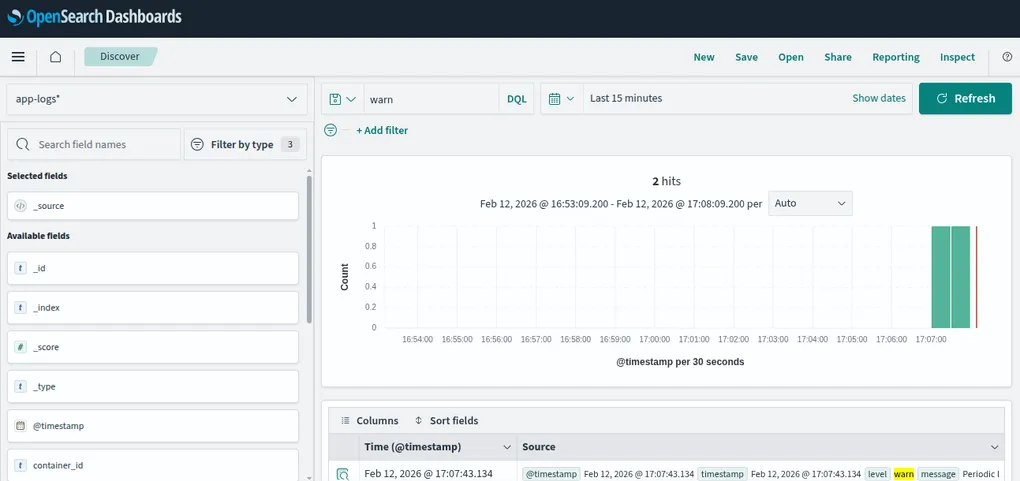
Now that the index pattern has been setup, navigate to ☰ → Discover
You should now see your logs streaming in. Try typing error or warn in the search bar to see only those log levels. You can also use the field filters on the left panel to narrow down by level, service, or message.
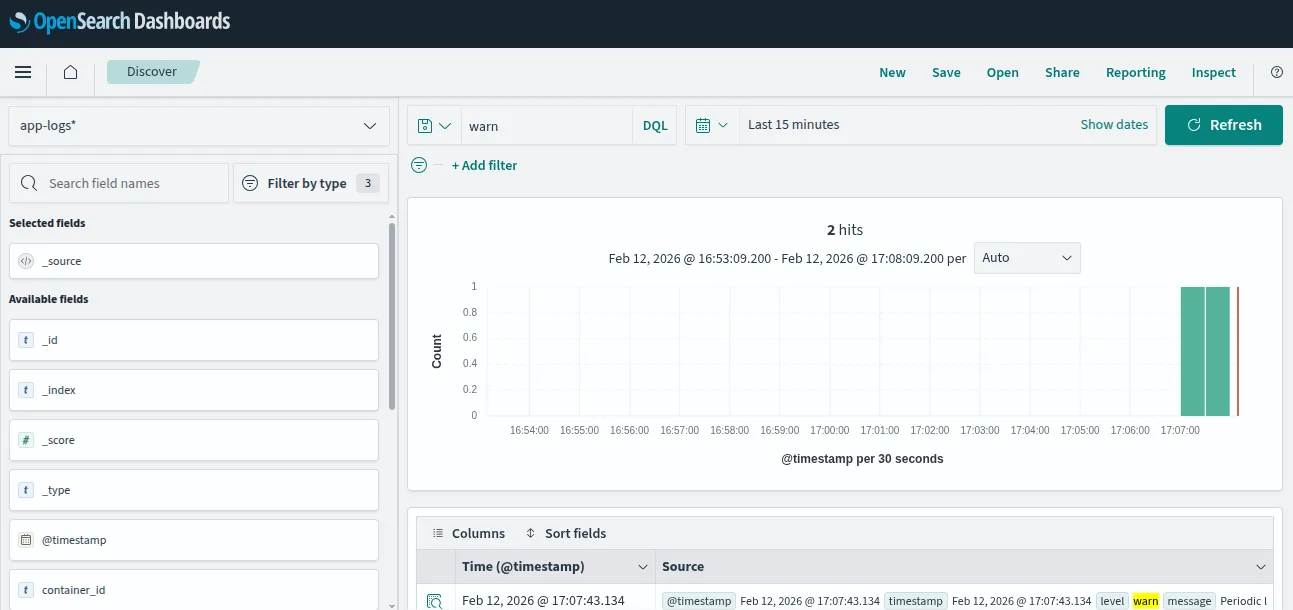
The app-logs-* wildcard in the index pattern matches daily indices like app-logs-2026.02.12. Fluent Bit creates a new index for each day automatically. This is the Logstash format and is a common pattern that makes it easy to manage retention by deleting old indices.
Stopping and Cleanup
You can stop the whole system by running either one of these commands:
# Stop all containers (without removing logs indexed)
docker-compose down

# Stop and remove all data volumes (wipes indexed logs)
docker-compose down -v
Good to Know: Sending Logs from a Virtual Server (EC2, DigitalOcean Droplets etc)
Containers are convenient for local development, but many teams run their applications on virtual machines. On AWS, that means EC2 instances; on DigitalOcean, the equivalent product is a Droplet, a simple Linux VM you spin up in seconds from the DigitalOcean control panel. Both are just Ubuntu (or Amazon Linux, Debian, etc.) servers under the hood and the Fluent Bit setup is identical on either one.
You install Fluent Bit directly on the host via sudo apt install fluent-bit on Debian/Ubuntu-based systems (which covers most Droplets and many EC2 AMIs) or via the official AWS-maintained package for Amazon Linux. Then, you can configure it to tail your application’s log files instead of listening on a TCP port. The [INPUT] section changes from forward to tail with a Path pointing at your log directory (e.g. /var/log/myapp/*.log) and the [OUTPUT] section points at your OpenSearch endpoint’s hostname or IP instead of a Docker service name. If your OpenSearch cluster is on another VM in the same cloud, use its private IP; if you are using AWS OpenSearch Service, use the domain endpoint from the console.
One practical consideration regardless of cloud provider: make sure the Fluent Bit service is managed by systemd so it restarts automatically on crash or reboot (sudo systemctl enable fluent-bit). The main difference between EC2 and Droplets when it comes to networking is the firewall tool. EC2 uses Security Groups configured in the AWS console, while DigitalOcean uses Cloud Firewalls (also in their control panel) or the host-level ufw. Either way, you need to open port 9200 (HTTP) or 443 (TLS) between your VM and your OpenSearch endpoint. For log files that rotate via logrotate, Fluent Bit’s tail plugin handles this gracefully by tracking file inodes rather than names, so rotation does not cause missed log lines.
Next Steps
Now that logs are flowing into OpenSearch, check out Daniel’s post Observability 101: Start with Logs to set up monitors and alerts on top of this data. You will learn how to define a monitor that watches for error spikes and fire notifications to Slack. The exact use case this pipeline is built for.
Once alerting is in place, you can consider adding metrics (container CPU/memory via Fluent Bit’s cpu or mem input plugins) and eventually traces (OpenTelemetry → OpenSearch Trace Analytics). But as Daniel rightly points out - start with logs. You can do a lot with just that.
Lastly, don’t forget to just play around with OpenSearch. They have a lot of cool features that I cannot cover with just one blog post.
If you like my blog post, you can read more about observability here