Open-Sourced Observability Stacks for Startups
You’re building something that matters, your product is gaining traction, and suddenly everything’s on fire at 3 AM and you have no idea why. You need observability. Yesterday. (If you need a good explanation of observability, here is one.)
So, you do what everyone does. You sign up for Datadog or New Relic, paste in an API key, and breathe a sigh of relief. Problem solved, right?
Fast forward six months. Your observability bill is now your third-largest expense after payroll and AWS. You’re paying $2,000 a month to watch logs scroll by. The finance team is asking pointed questions. And here’s the kicker: you’re not even using half the features you’re paying for.
There’s a better way.
The Startup Reality: Observability Is Necessary, but Expensive
If you’re running any kind of production system, you need logs, metrics, and traces. The question isn’t whether you need observability. It’s how you’re going to afford it without getting completely hosed by vendor pricing.
The problem with managed observability tools is that their pricing models are designed to scale with your data volume, not your revenue. You send more logs? Pay more. You add custom metrics? Pay more. Your traces get more detailed? You guessed it. Pay more.
This creates a perverse incentive: the more your product succeeds and generates data, the more you pay for the privilege of understanding that success. Your observability costs will likely grow faster than your actual business metrics, which is unsettling when you think about it.
Here’s the truth nobody tells you: most startups don’t need everything, everywhere, all at once. You don’t need full-fidelity traces on day one. You probably don’t even need custom metrics for every single component. What you need is enough visibility to stay out of trouble while keeping your costs sane.
Why Open-Source Observability Is a Serious Option Now
Five years ago, I would have told you to just bite the bullet and pay for SaaS observability. The open-source options were fragmented, complex to operate, and honestly kind of janky.
That’s changed. Dramatically.
OpenTelemetry has emerged as the de-facto standard for instrumentation. It’s vendor-neutral, cloud-agnostic and supported by basically everyone. This means you can instrument your code once and send that data wherever you want—no vendor lock-in, no proprietary formats.
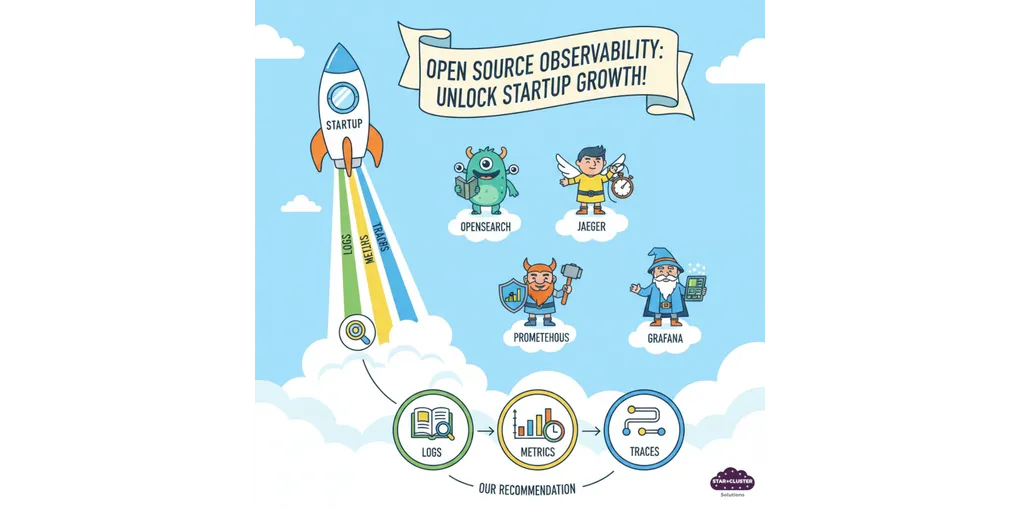
The ecosystem around open-source observability has matured into something genuinely production-ready:
- OpenSearch handles logs with enterprise features that would make Splunk jealous
- Prometheus or Victoria Metrics give you metrics
- Jaeger provides distributed tracing that actually works
- Grafana is a dashboarding solution that can help connect metrics, traces and logs all under its UI
- IncidentFox is a new AI tool to help you triage incident and even run some basic runbooks.
These aren’t hobby projects anymore. They’re battle-tested, running at scale in companies you’ve heard of, with active communities and commercial support options if you need them.
The big win? No ingestion tax. You’re not paying per gigabyte of logs or per million spans. You’re paying for infrastructure-storage and compute, which is predictable and scales more reasonably with your business.
A Reference Open-Source Observability Stack for Startups
Alright, enough philosophy. Let’s talk about what an actual stack looks like.
Here’s a reference architecture that’s worked well for early-stage teams:
Metrics: Prometheus
Prometheus is the gold standard for metrics collection. It’s pull-based (it scrapes metrics from your services), has a powerful query language (PromQL) and integrates with everything. You run Prometheus to collect and store metrics, and it handles the heavy lifting of time-series data.
Traces: Jaeger + OpenTelemetry
OpenTelemetry instruments your application code to generate trace spans. Jaeger receives, stores and lets you query those traces. Together, they give you end-to-end visibility into request flows across your microservices.
Logs: OpenSearch
OpenSearch (the open-source fork of Elasticsearch) stores and indexes your logs. It’s fast, scalable and has a solid query interface. You can search through millions of log lines in seconds and set up log-based alerts.
Single Pane of Glass: Grafana
This is where everything comes together. Grafana connects to Prometheus, Jaeger and OpenSearch, giving you unified dashboards. You build charts, set up alerts and correlate signals across logs, metrics, and traces—all in one place.
Storage: S3-Compatible Object Storage
For long-term retention, you don’t want to keep everything in memory or on expensive disks. Use object storage (AWS S3, MinIO, Backblaze B2) for older data. Thanos can extend Prometheus with unlimited retention using S3. OpenSearch can archive old indices to S3. It’s cheap and scales infinitely.
Alerting: Alertmanager
Prometheus’s Alertmanager handles alert routing, deduplication, and notification. It integrates with Slack, PagerDuty, email, webhooks or whatever you need to wake people up when things break.
Alternatively, you can also alert based on your cloud platform metrics.
AI Incident Management: IncidentFox
IncidentFox is a new AI tool available that will help you investigate your alerts and come up with a possible resolution. I can see this being very helpful with dealing with failures happening middle of the night.
What You Don’t Need at Day One
Here’s the thing: you can’t eat this entire elephant in one bite.
Start with logs. Seriously. Get your application logs flowing into OpenSearch and searchable. This alone will solve 70% of your debugging problems. You can stand up OpenSearch, point your apps at it and immediately start troubleshooting issues without SSHing into servers.
Metrics come next, but you’re probably already getting some for free from your cloud platform. AWS CloudWatch, Google Cloud Monitoring and Azure Monitor all provide basic infrastructure metrics. You can live with these for a while. When you’re ready, add Prometheus to capture application-level metrics that actually matter to your business.
Traces can probably wait. They’re powerful, but they’re also the most complex to implement and the most expensive to store. Unless you’re dealing with gnarly distributed systems issues right now, you can defer this until you have logs and metrics dialed in.
Resist the urge to boil the ocean. Build incrementally. Get value from each component before moving to the next.
Common Mistakes Startups Make When Going Open-Source
Let me save you some pain by sharing what I’ve seen teams do wrong:
Over-collecting data “just in case”
You don’t need DEBUG-level logs from every service streaming in 24/7. You don’t need to trace 100% of requests. You don’t need to store 90 days of high-cardinality metrics. This bloats your storage costs and makes queries slow. Be ruthless about what you actually collect. Sample traces aggressively. Set log levels appropriately. Only store what you’ll actually use.
No retention or cardinality controls
Metrics with unbounded cardinality will absolutely destroy your Prometheus instance. If you’re generating unique time series for every user ID or session ID, you’ll run out of memory fast. Set retention policies. Archive old data to object storage. Don’t let your observability system become more expensive than the thing you’re observing.
Treating observability as a DevOps-only problem
Your developers need to care about observability too. They’re the ones writing the code that generates logs and metrics. If observability is just something the ops team bolts on afterward, you’ll end up with noisy, useless data. Make instrumentation part of your development culture. Good observability starts with good instrumentation, which starts with developers who give a damn.
Underestimating operational effort
Running your own observability stack isn’t free. You’re trading money for time. Someone needs to maintain these systems, upgrade them, tune them, and fix them when they break. If your team is three engineers who are all buried in feature work, maybe SaaS makes more sense. Be honest about whether you can afford the operational overhead.
When Open-Source Beats SaaS (and When It Doesn’t)
Look, I’m not here to tell you that open-source is always the answer. It’s not.
Open-source makes sense when:
- You want predictable costs. You’re willing to do the math, provision the infrastructure and know exactly what you’ll pay each month. No surprises, no bill shock, no vendor phone calls asking you to upgrade your plan.
- You can afford some operational ownership. You have someone (or a few someones) who can manage these systems. Not full-time, but enough to keep things running and handle the occasional fire drill.
- You value flexibility and control. You want to own your data, run wherever makes sense, integrate with weird stuff and not be constrained by vendor roadmaps or pricing policies.
SaaS might still make sense when:
- Your team is growing fast and you need to move quickly. If you’re doubling headcount every quarter and shipping features at breakneck speed, operational complexity is your enemy. Pay the SaaS tax and stay focused on your actual product.
- Time-to-market beats cost concerns. Sometimes the right answer is to move fast and optimize later. If observability costs are a rounding error compared to your burn rate, just use the SaaS tool and revisit this decision in six months.
- Your company’s finance is strong. If you’re well-funded and cost optimization isn’t a priority yet, there’s no shame in using managed tools. They work, they’re supported and they’re one less thing to worry about. Just go in with your eyes open about what it’ll cost at scale.
Ready to Start or Improve Your Observability Journey?
If your company hasn’t adopted comprehensive observability tools yet, you’re in a great position. You can start with open-source and avoid the vendor lock-in trap from day one.
If you’re already using a SaaS tool and watching the bills climb, it’s not too late. Migration is work, but it’s often less painful than you think. Also, the ROI can be massive.
Here’s what I’m offering:
1 hour free consultation plus 1 hour free preliminary requirement gathering. We’ll talk through your specific situation, your team’s capabilities and whether open-source makes sense for you. No sales pitch, just honest advice.
If you decide to move forward, I can help with:
- Observability roadmap planning tailored to your stage and needs
- Implementation and setup of your open-source stack
- Training for your team so they can operate and maintain the system
- Ongoing maintenance service if you want the benefits of self-hosted without the operational burden
I also offer fixed-price setup packages for teams that want clear costs upfront. No hourly billing uncertainty, no scope creep. You know exactly what you’re getting and what it costs.
The goal isn’t to make you dependent on me. It’s to help you build observability infrastructure you can own, operate and scale without breaking the bank.
Interested? Drop me a line. Let’s talk about what observability should actually cost and how to get there.